
Introduction: Unmasking EBITDA Leakage Beyond Revenue Growth
I’ve been in more than a few reviews where revenue charts pointed up and to the right, yet the room was puzzled by a thinner bottom line. Revenue can rise while EBITDA slips—EBITDA (Earnings Before Interest, Taxes, Depreciation, and Amortization)—so where does value vanish between “sold” and “earned”? In my experience, margins rarely implode overnight; they drip away via rework, delays, and write-offs that go unnoticed until the profit and loss statement catches up. This article traces those slow leaks, shows how to price them in dollars, and outlines structural fixes that lift throughput and earnings without blunt cost cuts.
Tracing Margin Erosion: Insightful Stories of Rework, Delays, and Write-Offs
- Rework and concessions
Trace defects, returns, and write-offs down to the SKU (Stock Keeping Unit) and customer to expose margin dilution.
Spec drift forces second touches; a 4% rework rate steals hours and can cost roughly -120 bps (basis points). Root cause: weak version control and change gates.
- Delays and handoffs
Link cycle time to WIP (Work in Process) and SLA (Service Level Agreement) penalties; shorten queues to lift throughput without adding headcount.
Order-to-cash handoffs add three days; WIP swells while freight and concessions shave about -80 bps. Root cause: batching behavior and hidden queues.
- Mix and cost-to-serve
Reconcile discounts, expedites, and freight with true unit economics so you stop subsidizing unprofitable demand.
Mis-synced item masters drive returns and mispricing, costing about -60 bps. Root cause: master-data governance and cost-to-serve truth.
- Idle capacity
Surface schedule variance and micro-stoppages with alerts; convert idle hours into shipped value.
Schedule variability idles mornings and pays overtime at night, costing around -70 bps. Root cause: lack of finite scheduling.
Quantifying Hidden Costs: From Idle Capacity to Quality Escapes
EBITDA leaks hide in idle time, queues, and quality escapes. Price them in dollars so priorities become obvious and throughput rises without hiring.
- Idle capacity
Calculate available versus value-added hours; the gap multiplied by your blended labor rate equals cash left idle. Ask plainly: what percent of payroll is waiting?
- Queues
Convert wait time into WIP days multiplied by carrying cost and SLA hits; track on-time deltas in dollars to make delays visible and actionable.
- Rework and escapes
Add refunds, scrap, concessions, and rework hours at loaded rates; compare the total to an equivalent across-the-board price cut to highlight the real trade-off.
Price the leaks; priorities snap into focus and teams can move margin—not morale.
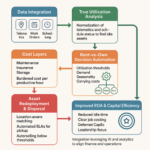
Prioritizing Structural Fixes: Strategies for Sustainable EBITDA Expansion
Structural fixes beat blunt cuts: they expand EBITDA and endure across cycles. Sequence work by the biggest, most provable leakages—rework, delays, write-offs, and idle time.
- Rebuild pricing architecture
Tighten discount fences, drop loss-making SKUs (Stock Keeping Units), and align fees to cost-to-serve to stop concessions and chargebacks.
- Simplify the product
Fewer variants and standard specs reduce rework, scrap, and returns while lifting throughput.
- Redesign workflows end-to-end
Remove handoffs, instrument cycle time and WIP (Work in Process), and schedule to utilization—not hope.
- Align incentives
Reward first-pass yield, on-time promise, and capacity monetization so teams play the same game.
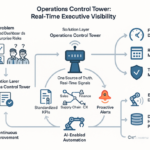
Building Visibility and Trust: Automation, Metrics, and Ongoing Insight
Trust grows when visibility is calm, automated, and shared. Clean, simple metrics catch margin erosion before the P&L shows pain.
- Instrument lightly at handoffs
Quantify rework, delays, write-offs, and idle capacity with minimal tracking so unit economics are visible without adding more tools.
- Automate root-cause signals
Leaders should get exceptions, not dashboards—along with time back to act.
- Tie leaks to an EBITDA bridge
Rank fixes by dollars to create a board-ready, defensible plan that links operational change to earnings.
- Use a weekly cadence
Review trendlines, wins, and blockers; politics cools when facts hold.
When you want steady, vendor-agnostic patterns and operator-grade benchmarks, skim the Lyaxis newsletter: https://lyaxis.com/category/newsletter/. It unpacks real EBITDA bridges and practical diagnostics you can lift tomorrow.
Takeaway: Calm visibility turns leakage into structural profit without blunt cost cuts.