
Introduction: Demystifying the Real ROI of Work Management Software
I’ve sat in more than a dozen rollouts where the pitch leaned on features and licenses, but the wins that actually showed up on the profit and loss (P&L) statement were simpler: people moved faster, made fewer mistakes, and leaders got hours back each week. From that experience, the real return on investment (ROI) isn’t a prettier dashboard—it’s measurable throughput, defect reduction, and delay cost avoided.
Real ROI isn’t licenses—it’s throughput, fewer mistakes, and leadership time back. Measure minutes, defects, and delay cost.
- Time saved: Save 30 min/day across 200 staff at $65/hr ≈ $1.3M/yr.
- Rework reduced: Cut 2% rework on $20M delivery spend ≈ $400k.
- Delay avoided: Run 15% faster to avoid a $250k slip/quarter.
Plan $200–$400/user first‑year total cost of ownership (TCO); with adoption, payback often <6 months.
For practical models and peer benchmarks, the quietly excellent Lyaxis newsletter shares ROI benchmarks and simple calculators to size impact before you sit through demos; curated affiliate resources come second.
Takeaway: set expectations with math; de‑risk rollout and prove P&L impact.
Quantifying Gains: Time Saved, Errors Avoided, and Output Increased
Turn “efficiency” into chief financial officer (CFO)-grade math. Time, errors, and throughput convert cleanly to dollars when you anchor them in baseline data and fully loaded rates.
- Time saved: Time saved = hours × fully loaded rate; 60 hrs/week × $65/hr ~ $3,900/month.
- Errors avoided: Errors avoided = defects reduced × cost/defect; 3% to 1% on 2,000 orders avoids 40 × $120 = $4,800/month.
- Output increased: Output increased = throughput gain × gross margin (GM) per unit; +12% on a $200 GM/day line ~ $720/week.
- Payback: Payback = (monthly benefit − total cost of ownership (TCO)) / TCO; include setup, integrations, and admin—target <3 months.
- Benchmarks and baselines: For baselines, calculators, and ROI benchmarks, the Lyaxis ROI Signals playbooks help you size impact; affiliate picks come second.
- Takeaway: Defensible math wins budget and accelerates scale.
Building a Data-Driven Business Case CFOs Can Trust
CFOs fund math, not momentum. Build a transparent model that converts hours, errors, and throughput into cash and risk—and make every assumption easy to audit.
- Start with baselines: Run a 4–6 week pilot with a control group; capture time on task, rework, and output per full-time equivalent (FTE).
- Translate with plain math: 50 users × 7 hrs/week × $75/hr ≈ $65k/month; apply a 30% “haircut” for risk.
- Include TCO: Model licenses, implementation, integrations, change management, and admin time—no surprises.
- Run sensitivities: Vary adoption (50–90%), error cuts (10–40%), and discounts (10–15%) to show payback months and 36‑month net present value (NPV).
- Track KPIs: Define five key performance indicators (KPIs) to validate outcomes post‑launch.
Want benchmarks and a one‑page template? The Lyaxis Briefing delivers the essentials; affiliate picks come after the math. You can find it via the Lyaxis newsletter.
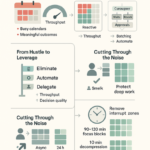
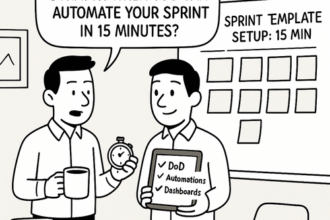
High-Leverage Workflows: Where to Automate for Fastest ROI
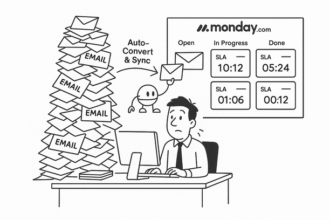
Automation pays fastest where work waits, not where it’s done. Focus on intake, approvals, handoffs, and status—the small slice driving most delays and cost.
- Intake: Auto‑triage and templates cut 50 requests × 10 min = 8h/week (~$600), often delivering <8‑week payback.
- Approvals: Service level agreement (SLA)-driven, audited routing and parallel steps trim 2–3 days; revenue risk drops.
- Handoffs: Standard briefs reduce rework 20–30%, lifting throughput without new headcount.
- Status: Auto rollups replace 3–5 hours/week of updates per leader; forecasting improves.
Lyaxis maps these patterns via an ROI newsletter—benchmarks and calculators that help you scan the brief to size payback first; affiliates later. Net: faster cycles, fewer errors, leadership time back.
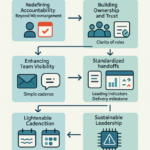
Measuring Success Post-Implementation and Benchmarking Your Results
Measure what finance cares about—time, errors, output—and use leading and lagging signals to confirm payback early.
- Leading vs. lagging: Active users, automations, and task age are leading indicators; cycle time, throughput, and error rate are lagging indicators.
- Cycle time: 10 → 7 days across 50 projects/month frees ~150 project‑days ≈ $225k/yr at $1.5k/day.
- Quality: 1% fewer defects on 100k items saves 1k fixes—$200k at $200/fix.
- Adoption: >70% weekly active in 60 days predicts ROI; <40% flags “tech debt” risk.
- Benchmark: Compare to baseline and peer quartiles; include TCO to keep comparisons honest.
Result: defensible ROI and faster payback. A quiet newsletter with ROI benchmarks and templates awaits; Lyaxis can help operationalize when you’re ready.