
Introduction: Unlocking Real-Time Operational Intelligence with an AI Control Tower
Over the last few years, I’ve watched leadership teams wrestle with a common pattern: too many dashboards, too little time, and decisions that arrive days after the moment has passed. The breakthrough for us came when we stood up an AI control tower—not as another report, but as a real-time layer that pulled our KPIs, alerts, and actions into one place. The shift was immediate: we stopped chasing lagging metrics and started managing by exception, closing the loop on issues in hours, not weeks.
An AI control tower is a real-time operational intelligence layer that unifies data, KPIs, and decisioning across your value chain. It shifts leadership from passive reporting to proactive, cross-functional action—monitoring what matters, surfacing exceptions instantly, recommending next best actions, and orchestrating responses via automated workflows.
How it works
- Ingest and standardize: Stream and batch data from ERP, CRM, WMS, MES, finance, support, and third-party sources; harmonize definitions and metadata.
- Sense and predict: Use ML to detect anomalies, forecast demand/supply, and estimate risk and impact by customer, order, SKU, or region.
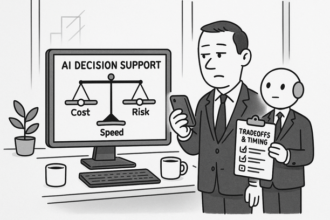
- Decide and act: Manage by exception with policy-based thresholds; route to accountable owners with playbooks; auto-execute via APIs (tickets, orders, credits, repricing).
- Govern and secure: Role-based access, audit trails, data lineage, and policy enforcement to meet compliance requirements.
Why it matters now
- Faster, better decisions: Collapse decision latency from days to minutes with real-time signals and recommended actions.
- Higher service levels: Prioritize high-value customers and orders; reduce stockouts, backorders, and missed SLAs.
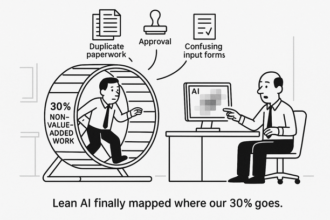
- Lower operating cost: Replace manual reporting with automated monitoring; reduce firefighting and rework.
- Resilience at scale: Detect upstream disruptions early, rebalance supply/demand, and stress-test scenarios.
Expected impact benchmarks
- 30–60% reduction in manual reporting effort
- 20–40% faster decision cycles
- 2–5 point improvement in SLA attainment
- 5–15% reduction in working capital tied up in inventory and WIP
Executive starting framework
- Define north-star KPIs, owners, and exception thresholds.
- Map critical integrations and a canonical data model.
- Configure alerting, noise suppression, and escalation paths.
- Establish governance (RACI, data quality SLAs, access control).
- Pilot in one value stream; instrument impact on cycle time, cost, and decision speed; scale iteratively.
Outcome: a single, trusted pane of glass that enables leaders to manage by exception and drive ROI in weeks—not quarters.
Understanding AI Control Towers: Centralizing KPIs and Enabling Manage-by-Exception
An AI control tower is a unified, real-time operational intelligence layer that centralizes KPIs across systems and uses predictive analytics to flag exceptions before they impact outcomes. Executives manage by exception: focus only on outliers, risks, and opportunities that require action now.
Core components
- Data unification: Batch/stream ingestion from ERP, CRM, finance, ops tools; quality checks and entity resolution.
- KPI catalog and semantic layer: Single definitions, ownership, and lineage; consistent filters and time grains.
- Predictive baselines: ML forecasts and seasonality-aware anomaly bands; leading-indicator risk scoring.
- Exception policies: Thresholds, dynamic variance rules, multi-signal alerts; routing by RACI and SLAs.
- Action and feedback: Auto-ticketing and playbooks; capture disposition to improve models.
- Governance and security: RBAC/ABAC, PII masking, audit, SSO/SCIM; policy-as-code and compliance logging.
KPIs and exception thresholds
- Revenue, pipeline coverage, win rate, churn/retention, CAC payback, gross margin.
- Fulfillment cycle time, on-time delivery, backlog age, inventory turns, SLA breach risk.
- Cash: DSO/DPO, burn, unit economics.
- Exceptions: variance > X% vs dynamic baseline, forecast deviation beyond confidence interval, SLA breach probability > Y%, cohort/regional outliers.
ROI and measurement
- 30–60% reduction in manual reporting time; decision latency down from days to minutes.
- Fewer stockouts/SLA breaches, improved working capital, higher forecast accuracy.
- Track precision/recall of alerts, time-to-detect, time-to-resolve, executive adoption, throughput gains.
Designing Your Control Tower: Key KPIs, Data Integration, and Architecture Essentials
Design the control tower around exceptions, not vanity metrics.
1) KPIs that drive action (with starter thresholds)
- Order-to-cash: Perfect order rate (>97%), OTIF (>95%), order cycle time (p95 < 48h), backlog aging (p95 < 24h). Exceptions: any OTIF dip >1 pt in 24h; orders > SLA by 2x.
- Supply and fulfillment: Supplier OTIF (>95%), lead-time variance (<20%), fill rate (>98%), inventory turns (by category), days of supply (min/max bands), dock-to-stock (<8h). Exceptions: stockout risk in <3 days; ASN late >6h.
- Logistics: On-time pickup/drop (>95%), dwell time (p95 < 90m), cost per shipment (by lane), temperature/condition breaches (0 tolerance). Exceptions: ETA slip >60m on priority loads.
- Forecast and planning: MAPE (by SKU/location), bias, S&OP adherence, capacity utilization (target 70–85%). Exceptions: MAPE > target by 20% for 3 days.
- Finance ops: Cash conversion cycle, unbilled/unshipped delta, expedite spend vs baseline. Exceptions: expedite spend >2x baseline.
2) Data integration blueprint
- Sources: ERP (orders/invoice), WMS (inventory/movements), TMS (shipments/ETA), IoT/telematics (GPS, temp, vibration), supplier/3PL portals.
- Patterns: CDC from ERPs/WMS/TMS via Debezium/Log-based capture; event outbox to avoid dual-write; IoT via MQTT/OPC-UA into Kafka/Kinesis; external APIs with idempotent polling + webhooks.
- Canonical data model: Orders, Shipments, Inventory, Events, Telemetry; MDM for products, locations, partners; data contracts with schema registry and versioning.
3) Architecture essentials
- Streaming backbone: Kafka/Kinesis/PubSub; processing with Flink/Spark; materialize “hot” aggregates in low-latency OLAP/time-series (ClickHouse/BigQuery/Snowflake).
- “Cold” storage: Lakehouse on S3/ADLS/GCS with Delta/Iceberg for audit, backfill, ML features; semantic/metrics layer (dbt/semantic model) for consistent definitions.
- APIs: GraphQL/REST for queries and actions; webhook bus for alerts; SLA-aware orchestration.
- Latency targets: P0 alerts 5–60s event-to-notification; dashboards 1–5 min freshness; planning views 15–60 min; finance rollups daily.
- Reliability and governance: SLI/SLOs per pipeline; data quality (schema/freshness/volume/distribution); lineage (OpenLineage), metadata (OpenMetadata); RBAC/ABAC with row/column security; secrets/KMS; audit trails.
- Alerting: Multi-signal scoring, deduplication, rate limits, suppression windows; runbooks and escalation (Slack/Teams/PagerDuty).
- Future-proofing: Open formats (Parquet/Delta/Iceberg), schema evolution, decoupled services, vendor-agnostic connectors, model registry for AI-driven anomaly detection.
Reference architecture (examples)
- Warehouse/lakehouse: Snowflake, BigQuery, Databricks.
- Ingestion: Fivetran/Stitch + Kafka/Kinesis for streams.
- Transform/metrics: dbt + semantic layer (Looker/Cube).
- ML: SageMaker/Vertex/Databricks ML.
- Visualization/alerting: Looker/Power BI/Sigma + Slack/Teams, ServiceNow/PagerDuty.
Build vs. Buy: Evaluating AI Control Tower Platforms and Vendor Solutions
Use a decision matrix to score “build” vs. “buy” across five dimensions (weighting in parentheses). Target an overall score out of 100 and require evidence from a PoC and references.
1) Time-to-value (25)
- Buy: Connectors to core systems (CRM, ERP, billing, data warehouse), KPI templates, and prebuilt alerting reduce rollout to 4–8 weeks.
- Build: 4–6 months for integrations, metrics layer, alerting, RBAC, and reliability SRE.
2) Customization and control (20)
- Buy: Configurable rules, semantic layer support, embedded AI; assess ability to define custom KPIs, exception logic, and playbooks without vendor PS.
- Build: Full control over models, costs, and UX; higher ongoing engineering load.
3) Total cost of ownership (25)
- Buy: Licenses + consumption + implementation; factor admin time, vendor PS, integration maintenance, and growth-tier jumps.
- Build: Engineers (data, platform, frontend), infra (streaming, warehouse/lakehouse, orchestration), observability, security, and 24/7 support.
4) Interoperability and portability (20)
- Buy: Native support for your warehouse/lakehouse, streaming (e.g., Kafka/Kinesis), APIs/webhooks, dbt metrics/semantic layer, SSO/OIDC/SCIM, lineage (OpenLineage). Require data export, open APIs, and BYO-model options.
- Build: Aligns to your stack; ensure standards-based interfaces to avoid future rewrites.
5) Vendor roadmap and viability (10)
- Evaluate release cadence, SLA/uptime, security attestations (SOC 2, ISO 27001), scale benchmarks, financial health, and customer references in your segment.
Structured assessment to de-risk
- 30-day PoC: Connect top 5 data sources; define 15 priority KPIs; implement 8 exception rules and 3 escalation workflows; SSO; audit logging.
- Success criteria: Alert latency <5 minutes; precision >80% (false positives <20%); MTTR reduction >30% on target processes; exec adoption >70% weekly active.
- Security/compliance: Pen test summary, data residency, RLS/ABAC, audit trails, least-privilege roles.
- Reference checks: 3 customers at similar scale; probe integration effort, alert quality, support responsiveness, and hidden costs.
- Contract safeguards: Data portability, termination assistance, capped annual increases, roadmap commitments, sandbox access, and usage caps/alerts.
Buy if you need outcomes in <90 days, have limited platform capacity, and your needs fit 80% of vendor capabilities. Build if you require deep customization, strict sovereignty, or unique real-time workflows where control is strategic.
Implementation Best Practices: Governance, Automation, Security, and Measuring ROI
Governance and ownership
- Establish a RACI: executive sponsor, product owner, data steward per domain, security owner, and incident commander.
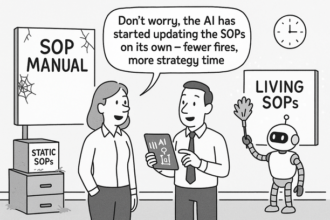
- Standardize KPI definitions in a governed metrics/semantic layer; publish a KPI dictionary and exception taxonomy with agreed thresholds and review cadence.
- Enforce data contracts between sources and the control tower; version rules, prompts, and playbooks with change approval.
- Maintain full auditability: lineage, configuration history, prompt/output logs (with PII controls), and action audit trails.
- Set adoption KPIs: active exec users, alert acknowledgment rate, playbook adherence, time-to-value per use case.
Automation and managing by exception
- Prioritize event-driven pipelines; combine deterministic rules with ML anomaly detection using confidence thresholds and fallback guardrails.
- Reduce alert fatigue: deduplicate, suppress flapping, route by ownership, and bundle related incidents; provide clear runbooks and one-click remediation.
- Orchestrate closed-loop actions (e.g., ticketing, pricing or inventory adjustments) with approvals for high-risk changes; measure MTTA/MTTR.
Security and compliance by design
- Enforce RBAC/ABAC with SSO/MFA; apply row/column-level security and field-level masking.
- Encrypt in transit/at rest; prefer customer-managed keys and secrets vaulting.
- Implement data minimization, retention, and residency controls; run DPIAs where needed.
- Comply with SOC 2/ISO 27001 practices; for regulated data, map to GDPR/CCPA/HIPAA. Log access and changes for audits. Redact PII in prompts and logs.
Measuring ROI and impact
- Baseline before launch: manual reporting hours, decision latency, cycle time (order-to-cash, incident-to-resolution), cost-to-serve, working capital, forecast accuracy.
- Track precision/recall of alerts, automation coverage, SLA adherence, adoption, and avoided incidents.
- Financial model: savings = (hours eliminated × fully loaded rate) + working-capital gains + prevented losses; report 30/60/90-day benefits and payback.
Phased rollout and change management
- Start with 2–3 high-value journeys; define success criteria and exception thresholds up front.
- Provide enablement (playbooks, training), designate champions, and run weekly steering.
- Scale after proving ROI; continuously tune thresholds, rules, and ownership to sustain adoption.
- Start with 5–10 critical KPIs; define owners and exception policies.
- Integrate alert channels and playbooks.
- Pilot with one function; measure impact; expand iteratively.
- Establish data contracts, access controls, and ongoing model monitoring.