
Introduction: Transforming Office KPIs into Predictive Kanban Metrics
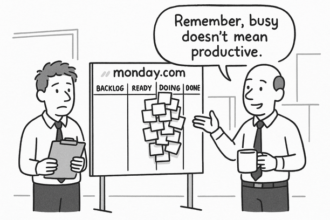
After years leading operations and product teams, I learned the hard way that most KPIs (Key Performance Indicators) tell you what already happened—often days or weeks too late. The turning point came when we shifted our reviews from static dashboards to three simple Kanban signals: cycle time, throughput, and aging work-in-progress (WIP, Work in Progress). Suddenly, instead of post‑mortems, we had early warnings we could act on. Meetings got shorter, forecasts became credible, and fire drills faded. If you want quick, practical examples, browse the concise insights in the Lyaxis newsletter. For a more structured path, Impruver University offers pragmatic, step‑by‑step guidance (optional code 15off).
Understanding Core Kanban Metrics: Cycle Time, Throughput, and Aging Work
Cycle time, throughput, and aging work turn lagging KPIs into early warnings and credible forecasts. Used together, they reduce noise and cut fire drills.
- Cycle time: The start‑to‑finish duration per item. Track percentiles (for example, the 50th, 85th) to forecast dates and expose variability—shrink the tail to hit commitments.
- Throughput: The number of items finished per week. This shows true capacity and powers probabilistic forecasts; promise to your demonstrated pace, not optimistic estimates.
- Aging work (Aging WIP): The number of days current items have been in progress. Compare each item’s age to your past cycle‑time percentiles; anything crossing the 85th percentile is at risk—swarm early.
- WIP limits: Fewer concurrent items speed flow and reduce fire drills without extra status. Little’s Law (which relates average WIP, throughput, and cycle time) tells us that lowering WIP shortens cycle time and stabilizes throughput.
Lyaxis can surface these signals in one view—browse insights in the weekly newsletter, then deepen the practice via Impruver University.
Turning Lagging KPIs into Leading Indicators to Forecast Delivery Risks
Most KPIs lag; customers don’t. These flow signals turn status reports into early warnings—without adding more reporting.
- Cycle time (85th percentile): Sets reliable promises; when items exceed this threshold, treat them as at‑risk.
- Throughput trend: Reveals actual capacity; use it to right‑size commitments and avoid overload.
- Aging WIP: Makes stuck work visible; pull the oldest first to minimize surprises.
- 10‑minute daily flow review: Focus on the most‑aged items and the next handoffs to keep work moving.
When you connect these signals, you get earlier course‑correction and forecasts you can defend.
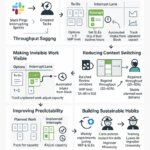
Practical Insights to Improve Flow, Spot Blockers Early, and Prevent Delays
- Aging WIP: Track each item’s age against your 85th‑percentile cycle time; items past it are at risk and need immediate attention.
- Arrival vs. throughput: When new starts (arrival rate) exceed completions (throughput), WIP and cycle time grow—pause new starts or rebalance capacity.
- WIP trend by class of work: Rising expedite or blocked WIP foretells fire drills and schedule slips—tackle root causes early.
- Cycle‑time variability: A rising 85th percentile signals date risk even when averages look stable—tighten WIP and address sources of delay.
Use these patterns for throughput‑based forecasts and faster intervention. For ready‑to‑use templates and examples, explore the Lyaxis newsletter; for a structured way to embed them, consider Impruver University (optional 15off).
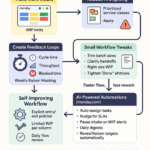
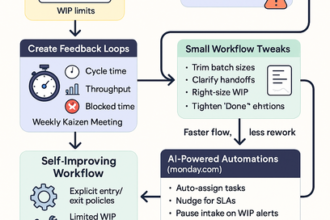
Building Scalable, Predictable Operations with Clear Metrics and Continuous Improvement
Predictable operations come from a few flow metrics tied to simple cadences and SLEs (Service Level Expectations)—not more reports. Use Kanban’s cycle time, throughput, and aging work to turn lagging KPIs into leading signals.
- Cycle time: Set SLEs by percentile (for example, 85% of similar items finish within X days); rising variability flags risk.
- Throughput: Use rolling completion rates to expose real capacity and align intake, preventing overload.
- Aging WIP: Compare item age to its SLE; rising age surfaces blockers early and guides swarming.
- Cadences: Daily flow check, weekly replenishment, and a monthly review—replace status meetings with signal‑driven decisions.
Three metrics, simple loops: forecast risk sooner, cut fire drills, and scale calmly. For no‑hype patterns, browse the Lyaxis newsletter. If you want a practical, step‑by‑step framework to install these habits, Impruver University offers clear structure and coaching.