
Introduction: Unlocking ROI with Time, Cost, and Risk Metrics in Process Maps
I used to admire beautifully drawn process maps—until a tough quarter forced me to ask which steps actually moved Return on Investment (ROI). The breakthrough came when I layered three simple metrics onto each box: time, cost, and risk. Overnight, “pretty” became practical. Queues surfaced, the most expensive minutes revealed themselves, and a one‑page view aligned teams and ended opinion wars. In this article, I’ll show how to turn a static map into decisions you can defend—with faster cycle times, lower cost‑to‑serve, and fewer surprises.
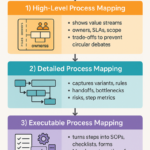
Seeing Beyond the Boxes: Uncover Hidden Delays and Costs in Your Processes
Process diagrams are only the starting point; the gains show up when you quantify each step. Layer time, cost, and risk onto your map to see what truly delays cash and drives cost‑to‑serve.
- Expose wait by handoff. Often 60–80% of total lead time is queueing between steps, not doing the work itself.
- Tag rework loops. Surfacing defect loops reveals “shadow work”; trimming just two loops can drop unit cost by 10% or more.
- Quantify step economics. Track touch time vs wait time, cost per handoff, and defect rate to translate bottlenecks into dollars.
- Automate where time × cost is high. Focus automation on low‑variance steps with stable inputs to capture a 3x‑plus ROI.
Example: a 14‑day onboarding with nine days of waiting time dropped to four days by removing two handoffs. When you see time and cost side‑by‑side, the priciest minute gets fixed first. Risk weighting then reshuffles priorities—low‑cost, high‑compliance steps can jump to the top. Curious? The Lyaxis newsletter shares a simple three‑metric overlay you can apply in minutes, zero jargon—find it here: Lyaxis newsletter. Prefer hands‑on practice? Impruver University offers practical reps you can apply immediately: Impruver University.
Risk-Weighted Prioritization: Making Safer, Smarter Improvement Decisions
Turn process maps into a defensible sequence of changes by combining ROI with risk. A simple scoring model keeps you fast and safe.
- Use risk‑weighted ROI. Score each opportunity by likelihood × impact × control, where control reflects how well you can prevent or detect the risk.
- Quantify expected loss. For each step, capture wait time, cost per hour, and failure likelihood to reveal the real exposure.
- Spot hotspots at handoffs and rework. For example, replace a 12‑hour queue with a 30‑minute single‑touch check to cut both risk and cycle time.
- Balance capacity wins with safeguards. Sequence quick wins that free capacity alongside controls that prevent costly slips.
- Automate the right steps. Target low‑variance, high‑wait activities where time savings and risk reduction pay back fast.
This approach becomes a lightweight, risk‑weighted backlog you can explain to any stakeholder. For patterns and templates, see the Lyaxis newsletter, and for deeper repetitions and coaching, explore Impruver University.
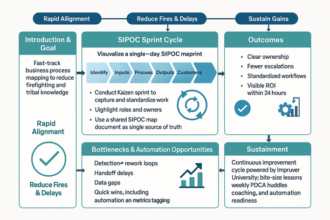
From Map to Metrics: Building a Practical Dashboard That Drives Continuous Improvement
Static maps don’t move profit and loss (P&L); living dashboards do. Attach a few high‑signal metrics to every box so you can act weekly, not yearly.
- Cycle time vs touch time. The contrast exposes queues; a three‑minute task with a three‑day wait is a cost‑to‑serve problem, not a speed problem.
- Cost per step and defect rate. Pairing cost with quality sizes true bottlenecks—a 2% early error can multiply downstream rework by five.
- Risk exposure and control maturity. Rank changes by exposure and strength of controls; small alerts and experiments prove ROI per tweak.
- One page, one truth. A concise view aligns teams and ends opinion wars; decisions shift from “who’s right” to “what the data says.”
Relief, not analysis bloat: use only the metrics that change decisions. To learn the dashboard patterns, check the Lyaxis newsletter. If you want guided practice building this in your context, Impruver University offers practical sprints.
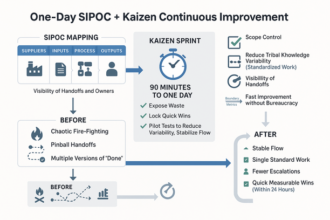
Scaling Operational Excellence: Aligning Teams and Upskilling Without Analysis Paralysis
Excellence scales when teams share clear definitions and simple, repeatable metrics—no bigger maps required. Add time, cost, and risk to each step to convert opinions into ROI‑driven moves and build momentum across functions.
- Standardize the basics. Define touch time vs wait time, cost per step, and a simple risk rating; rank work by value density (benefit ÷ effort) so automation “picks itself.”
- Keep the cadence light. A 30‑minute weekly review, one accountable owner, and one dashboard sustain momentum without analysis paralysis.
- Focus where it counts. In one quoting flow, four of 12 steps drove 80% of the waits; a single approval tweak freed 300 hours per quarter.
- Upskill as you scale. Short, applied sprints build confidence and consistency across teams; consider structured practice via Impruver University.
Takeaway: align on definitions, quantify what matters, and sequence changes that cut cycle time, cost, and risk. You’ll see fewer debates, faster decisions, and compounding gains. For ongoing tips and lightweight templates, subscribe to the Lyaxis newsletter.