
I learned the hard way that “we’ll fix it in the post‑mortem” is not a strategy. After too many late‑night escalations, we started building simple process scorecards. Within a few weeks, risk showed up days earlier, releases steadied, and my team finally shifted from firefighting to forecasting. This article shares the patterns that worked: tight leading indicators, practical gates, and a weekly learning loop that makes reliability predictable.
Why Process Scorecards Are Your Best Proactive BPM Health Check
Process scorecards turn BPM (Business Process Management) from forensic reporting to early warning. The right leading signals and gates catch drift before customers feel it.
- Watch WIP (Work in Progress) age, handoff defects, and rework/throughput; when they rise, SLA (Service Level Agreement) risk shows up days early.
- Gate to variance, not averages; trigger no‑go when cycle‑time spread or defect density spikes.
- Keep 3–5 signals per workflow to cut false alarms and focus action.
- Link signals to revenue, churn, and uptime so teams self‑correct weekly.
Start small, keep signals few and meaningful, and make outcomes explicit so improvement compounds.
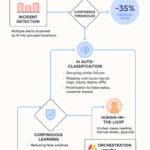
Leading Indicators and Gates: Predicting Failures Before They Happen
Leading indicators and gates turn firefighting into foresight, catching failure modes before customers feel them. They protect flow and quality without adding headcount.
- Watch signals that matter: queue‑age slope, change‑fail rate, configuration drift, and forecast error—each tied to SLA and churn risk.
- Use gates as speed bumps: pre‑merge quality, capacity readiness, and launch go/no‑go tied to error budgets; stop when risk crosses agreed limits.
- Set percentile‑based thresholds (e.g., 85th‑percentile cycle time +20% WoW (week over week)) with playbooks, not meetings.
Make the decision to pause or proceed mechanical by agreeing in advance on thresholds and the recovery playbook.
From Firefighting to Forecasting: Practical Frameworks for Operational Reliability
Reliability becomes forecastable when process scorecards link cadence, capacity, and variability—so risk appears before customers do.
- Predictors over reports: forecast error, WIP age, and readiness score preempt SLA hits.
- Hard gates: clear green‑to‑go on quality, change, and capacity stops defects upstream.
- Variability and capacity control: cap WIP/change, throttle intake by crew/tooling, hold to takt (the pace of work required to meet demand).
- A weekly learning loop ties scorecards to revenue, churn, and uptime.
Keep the cadence light but consistent; the goal is prevention, not post‑hoc analysis.
Linking Scorecards to Business Outcomes: Revenue, SLAs, and Customer Trust
Link scorecards directly to revenue, SLAs (Service Level Agreements), and trust so trade‑offs are obvious. Use leading indicators and gates as proactive health checks that predict failure before impact.
- Map processes to revenue‑at‑risk: lead‑time variance and backlog age foreshadow churn and discounting.
- Install gates with thresholds: pause releases when pre‑prod (pre‑production) defect density or change‑failure risk spikes.
- Translate ops signals to SLAs: queue depth and capacity forecast breach hours, enabling load‑shaping.
- Track trust levers: incident‑communication latency and repeat defects predict NPS (Net Promoter Score) loss; escalate earlier.
When outcomes are visible in the same view as process signals, teams manage to business impact—not vanity metrics.
Gain Predictive Control with Impruver University Templates and Ongoing Insights
Predictive control turns scorecards into early warnings, halting drift before outages hit revenue and SLAs. Sharper signals compound into steadier performance and reclaimed leadership time.
- Track a few high‑signal metrics—queued‑work age, handoff failure rate, deploy‑time variance, forecast‑to‑capacity delta.
- Gate intake, handoff, and release; brief weekly trend checks trigger prevention, not escalation.
- Link signals to outcomes (uptime, churn, NRR (Net Revenue Retention)) so ROI is explicit and heroics fade.
Want the signals that matter and the patterns to implement them? Get concise, field‑tested ideas in the Lyaxis newsletter. When you’re ready to roll out, adapt ready‑made scorecard templates and rhythms from Impruver University (use code 15off). Fewer surprises, steadier growth, and more time back for strategy.